There are centuries old historical structures that preserve a country’s and community’s
history for future generations and promote tourism opportunities.
To improve tourism, a government agency decides to use advanced machine learning
techniques to monitor the condition of these historical structures and report if any of
them need maintenance.
Also, understanding customers (tourists) and their expectations is critical for effective
marketing and promotion of tourism. A recommendation engine is an excellent way to
supplement existing marketing outreach.
XYZ Pvt. Ltd., a leading industry consulting firm, has been hired to help the cause by
developing an intelligent and automated AI model using TensorFlow that can predict the
category of a structure in an image.
Part 1:
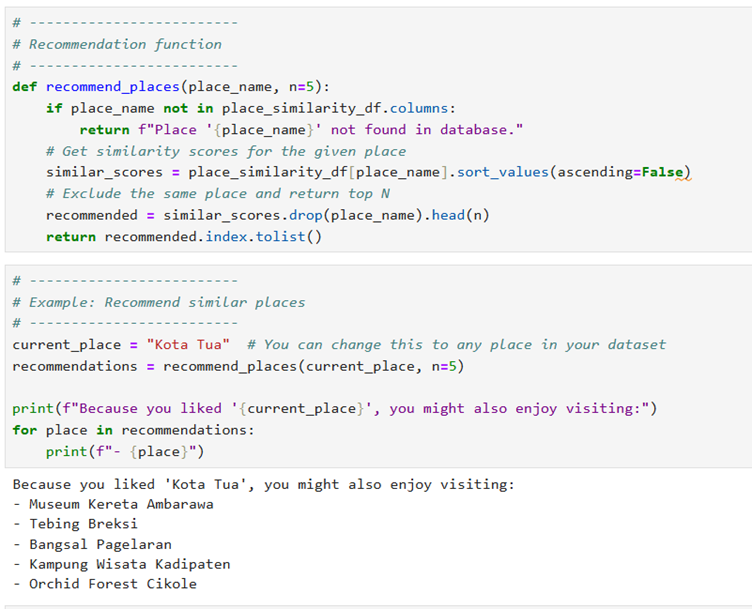
The second objective of this project requires you to perform exploratory data analysis
and develop a recommendation engine that will help tourists visit their places of interest.
Part 2:
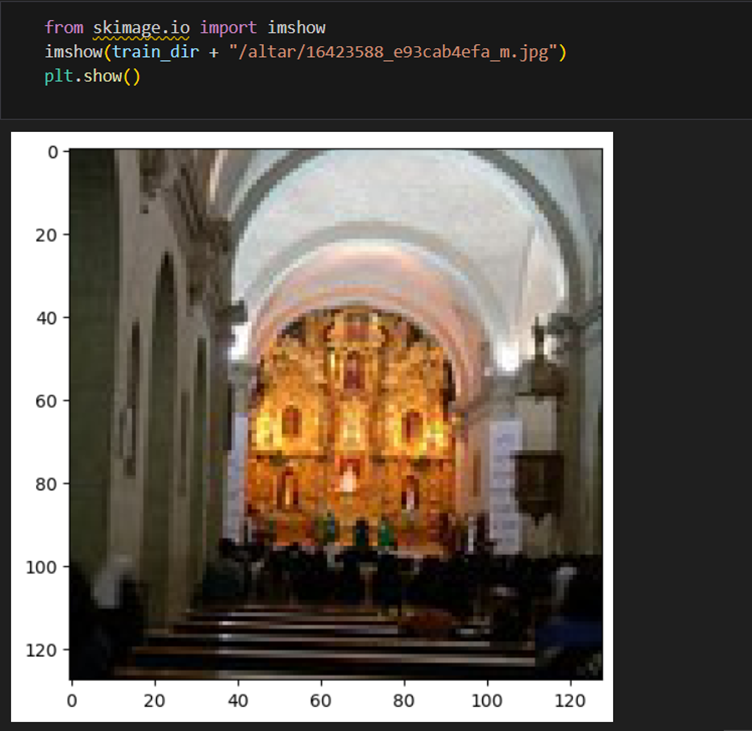
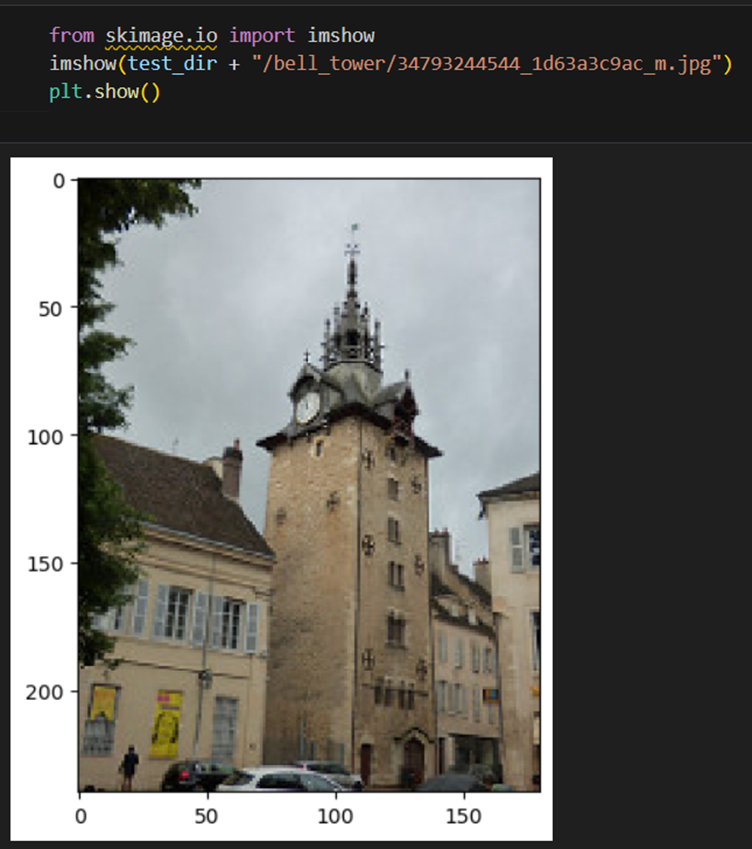
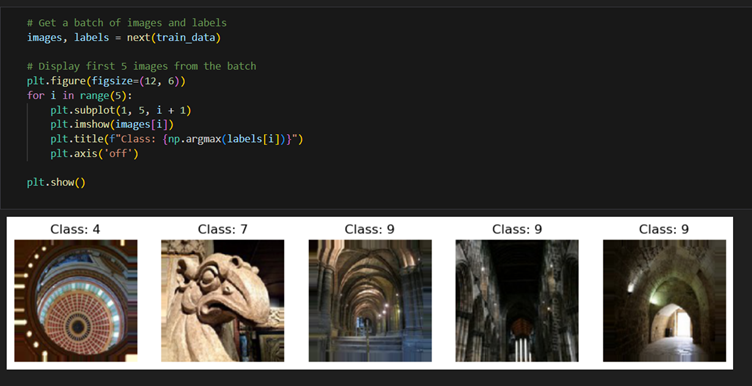
Plot sample images (8–10) from each class or category to gain a better understanding of
each class
Hint: You can use the OpenCV open-source library for this task.
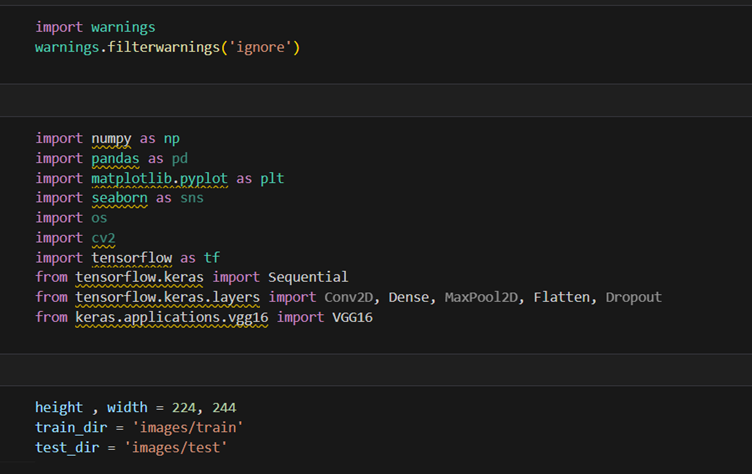
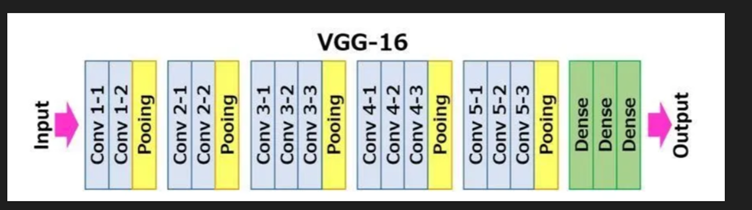
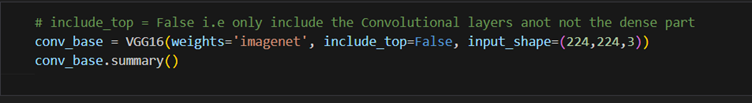
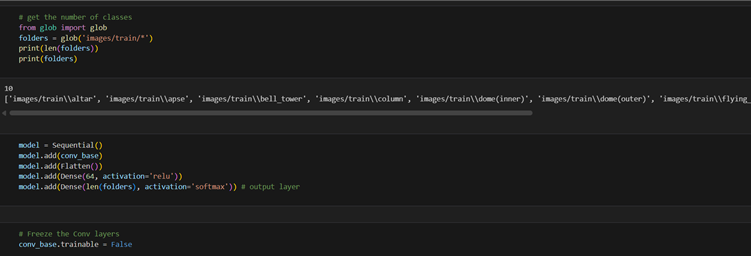
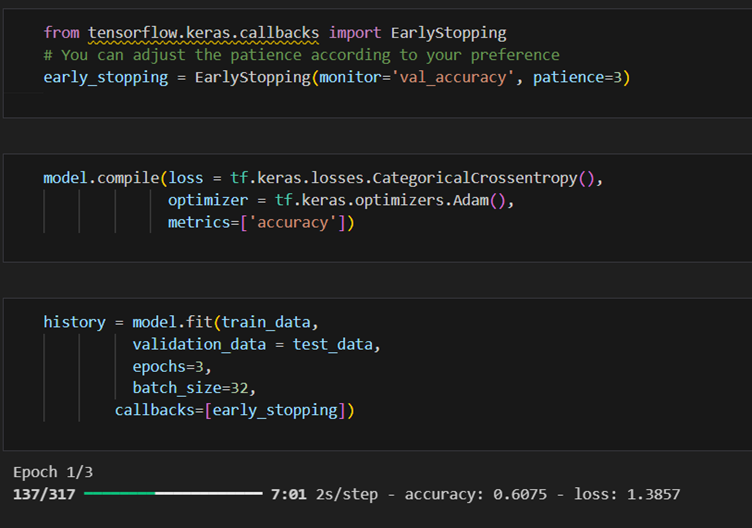
2. Select a CNN architecture of your choice to train the CV model. Configure the architecture
for transfer learning, set up a TensorFlow environment for the selected backbone
architecture, and load pre-trained weights
Note: Algorithm or architecture selection is an important step in the training of ML models.
So, select the one that performs the best on your dataset.
Here are project tasks completed – I put all excel source files and ‘images’ folder in same directory where .ipynb file exists so path for file can be easily obtained.
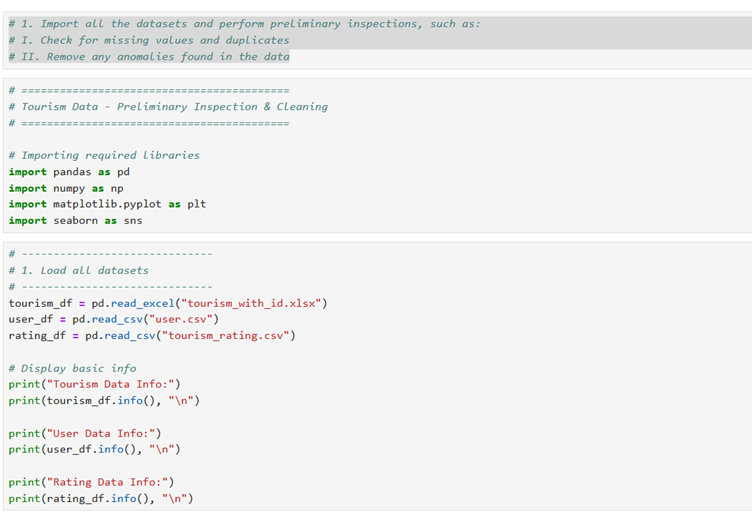
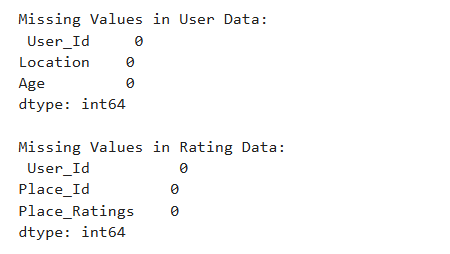
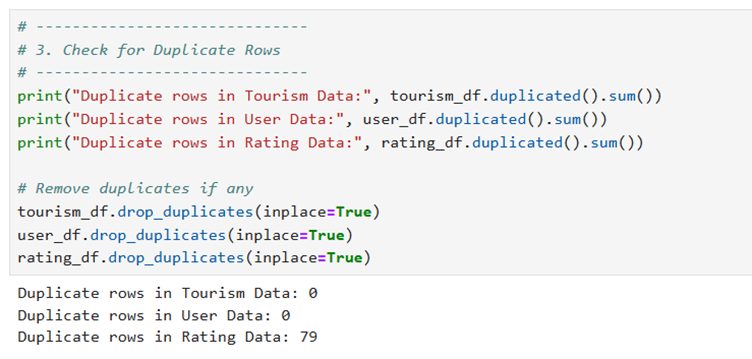
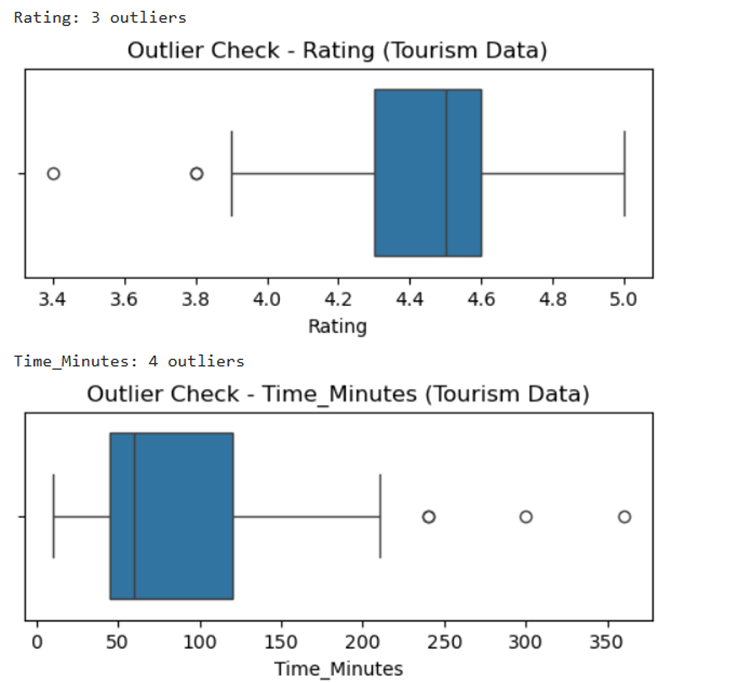
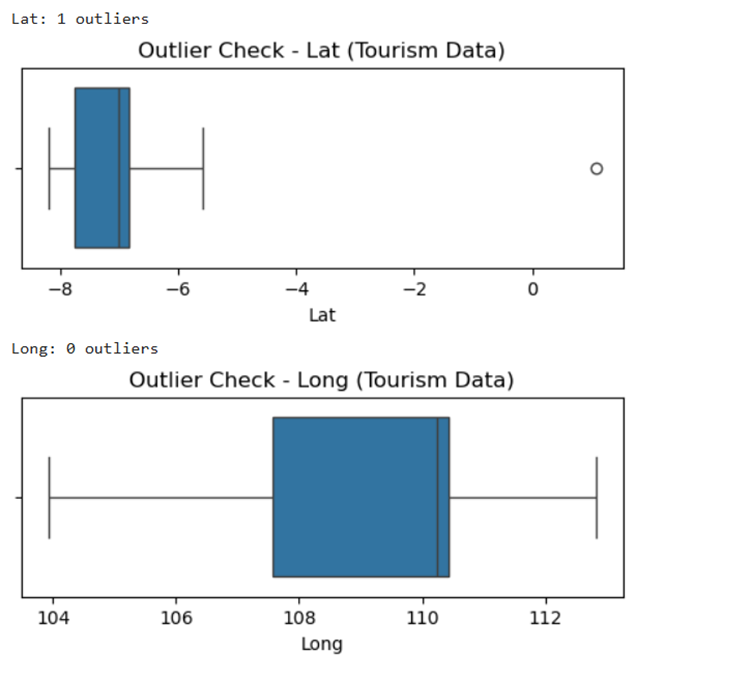
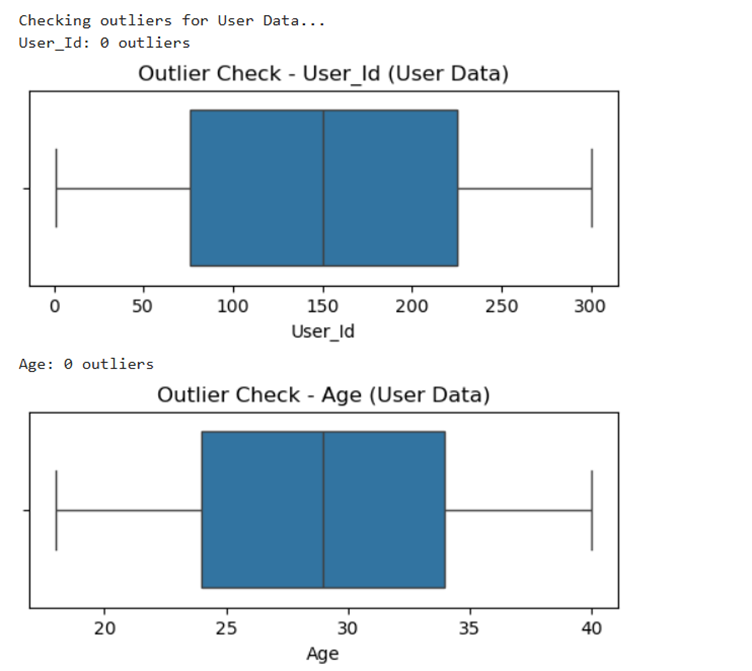
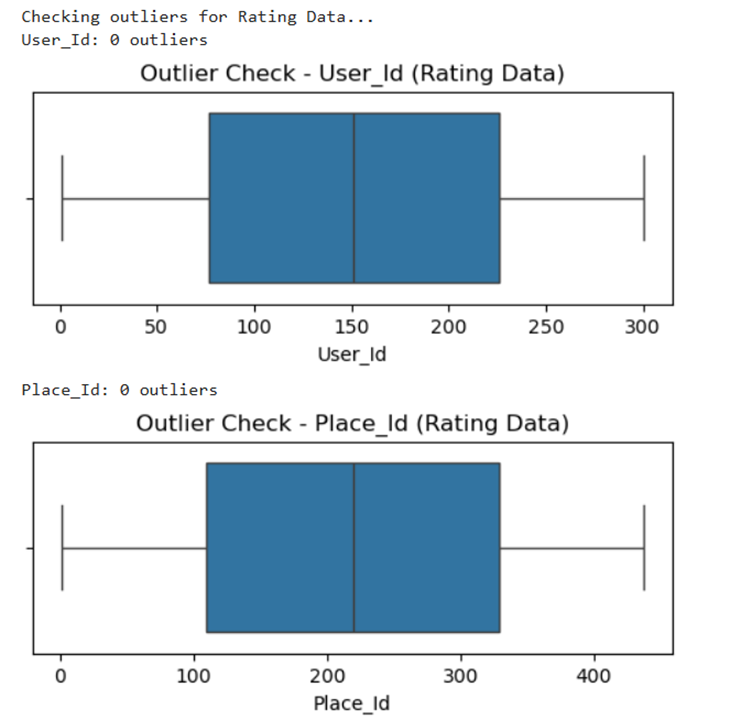
1. Import all the datasets and perform preliminary inspections, such as:
I. Check for missing values and duplicates
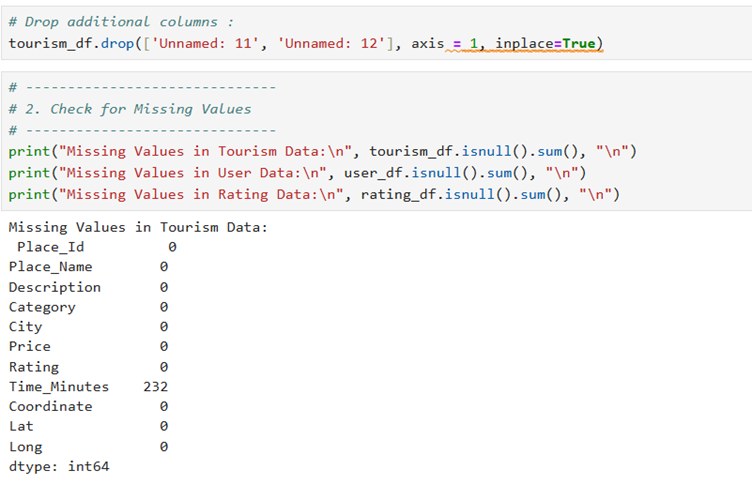
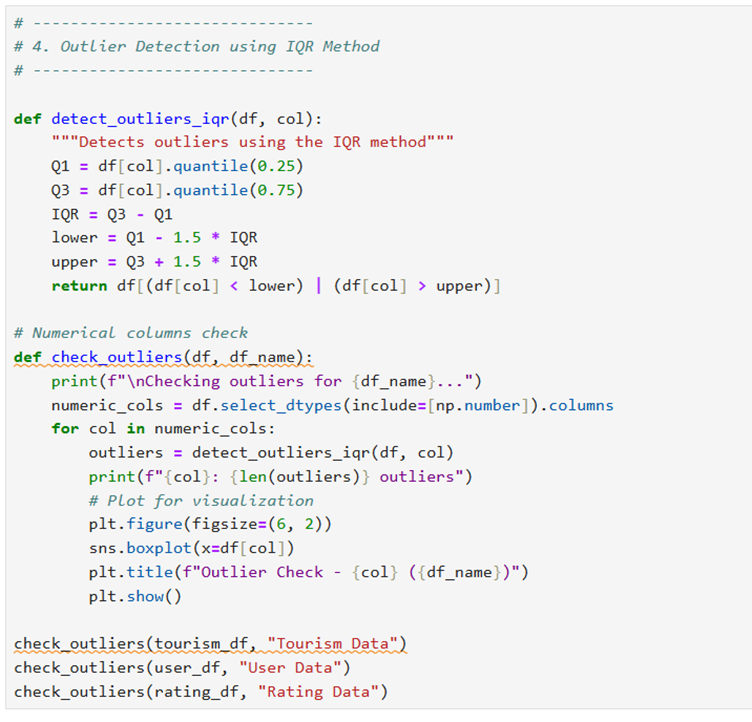
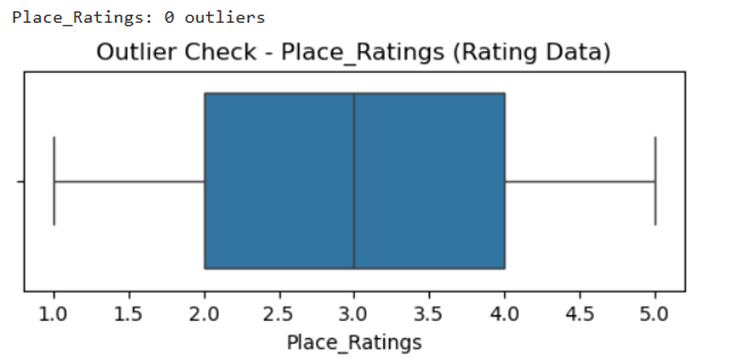
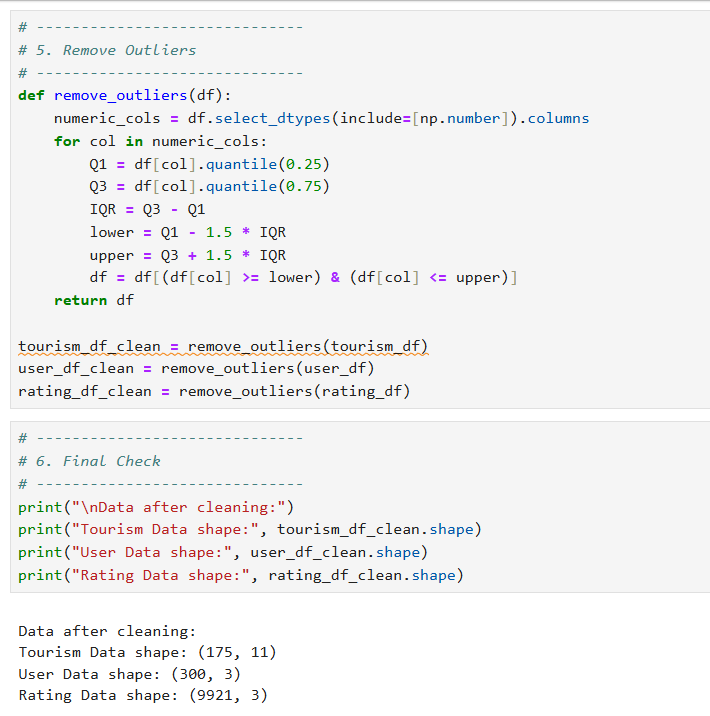
II. Remove any anomalies found in the data
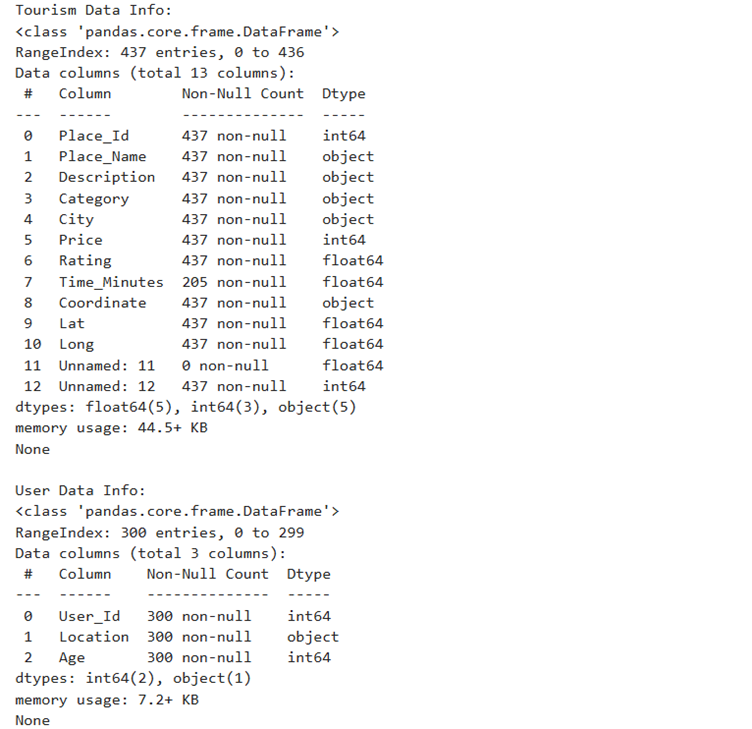
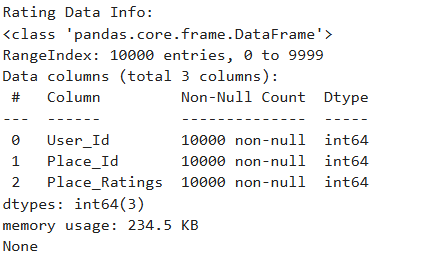
Output for this is as follows
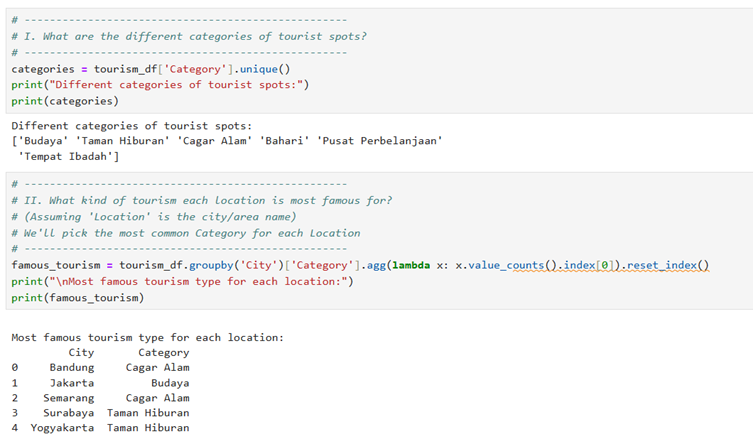
Output is as follows:
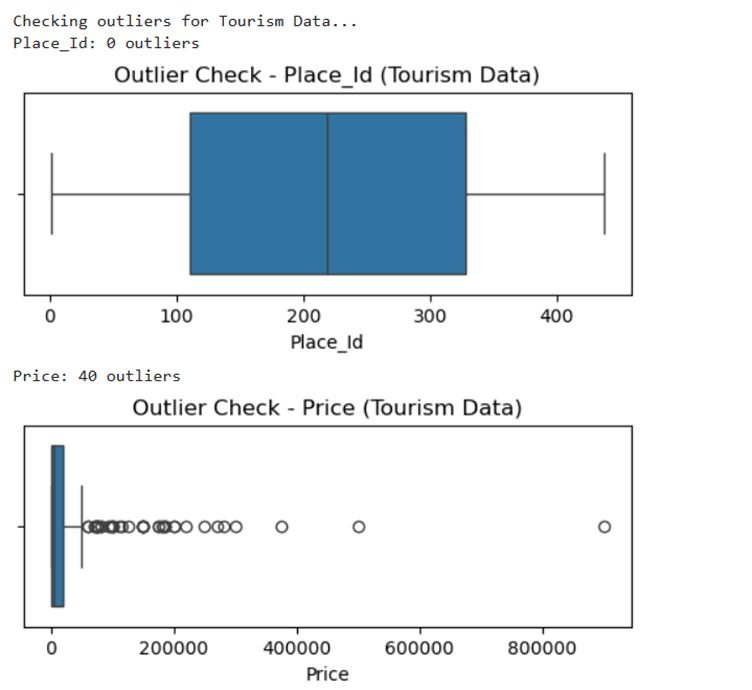
Output is as follows:
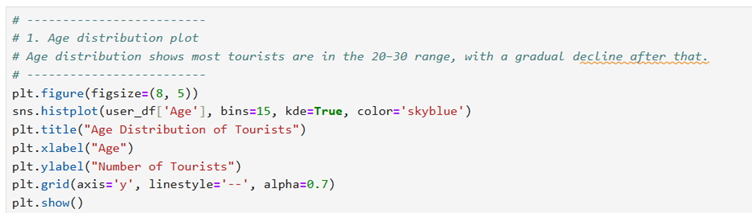
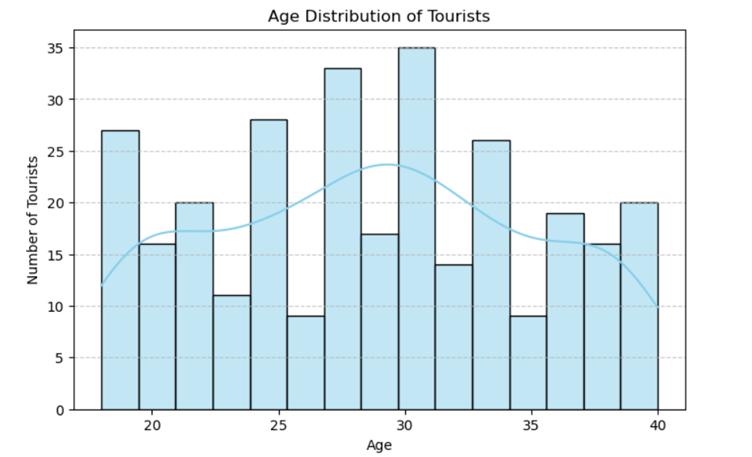
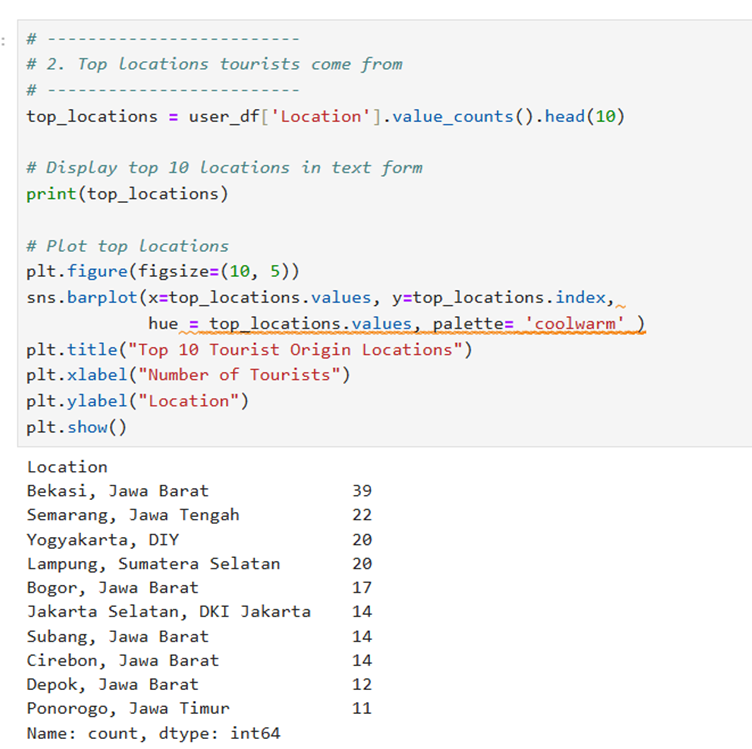
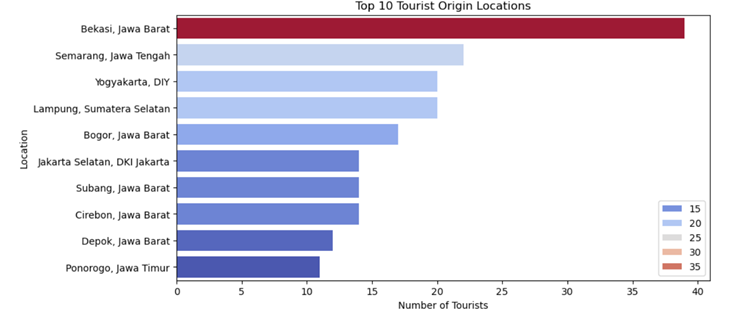
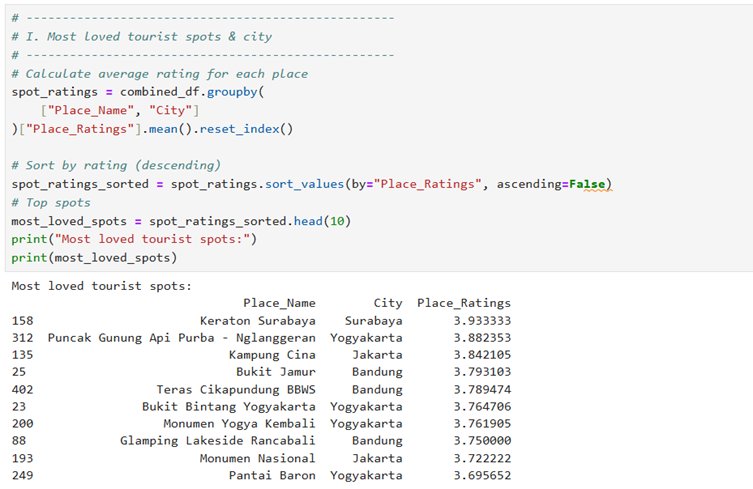
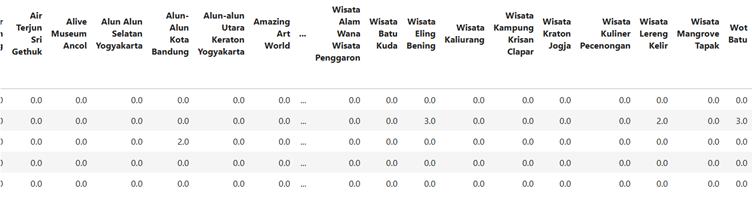
Output as chart is as follows:
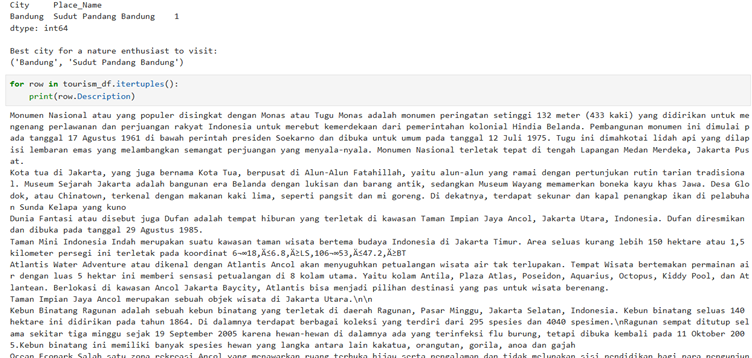
Now this was very interesting that description column has Indonasian language but I need English so I have to translate using LLM.
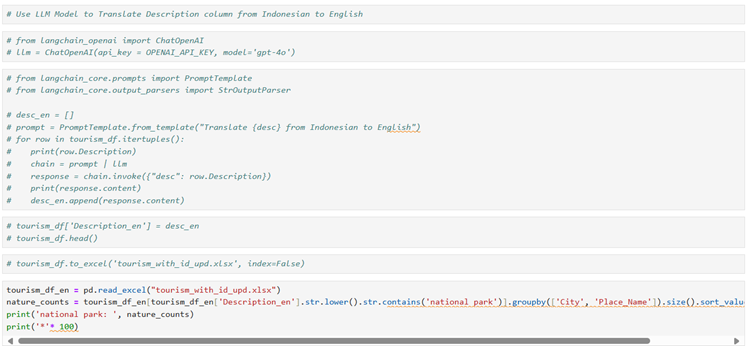
The selected code reads an Excel file and analyzes occurrences of “national park” in tourism data. Here’s a step-by-step explanation: 1. `tourism_df_en = pd.read_excel(“tourism_with_id_upd.xlsx”)` – This line reads an Excel file named “tourism_with_id_upd.xlsx” into a pandas DataFrame called `tourism_df_en`. 2. `nature_counts = tourism_df_en[tourism_df_en[‘Description_en’].str.lower().str.contains(‘national park’)]` – This filters the DataFrame to only include rows where the ‘Description_en’ column contains the phrase “national park” (case-insensitive). 3. `.groupby([‘City’, ‘Place_Name’]).size()` – Groups the filtered data by both city and place name, then counts the number of occurrences in each group. 4. `.sort_values(ascending=False)` – Sorts the counts in descending order (highest counts first). 5. `print(‘national park: ‘, nature_counts)` – Prints the string “national park: ” followed by the sorted counts. 6. `print(‘*’* 100)` – Prints a line of 100 asterisks as a visual separator.
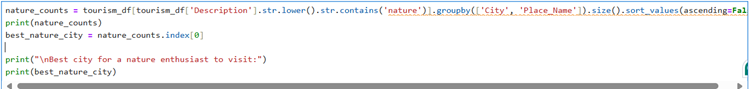
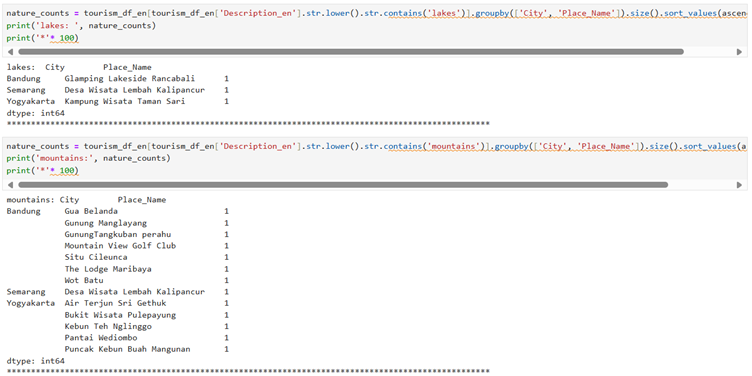
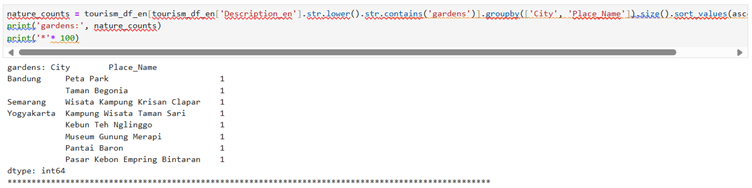
Once we understand this concept then we can find out about anything like ‘nature’ keyword
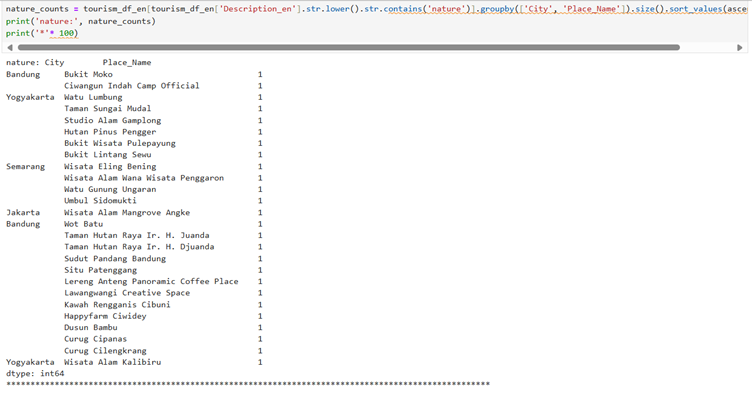
The selected code is analyzing tourism data to find and count places that mention “nature” in their descriptions. Here’s a step-by-step explanation: 1. `tourism_df_en[‘Description_en’].str.lower()` – Converts all description text to lowercase to make the search case-insensitive. 2. `.str.contains(‘nature’)` – Checks if the lowercase descriptions contain the word “nature”, returning a boolean mask. 3. `tourism_df_en[…]` – Uses this boolean mask to filter the dataframe, keeping only rows where descriptions mention “nature”. 4. `.groupby([‘City’, ‘Place_Name’]).size()` – Groups the filtered data by city and place name, then counts how many entries exist for each group. 5. `.sort_values(ascending=False)` – Sorts the counts in descending order (highest counts first). 6. `nature_counts = …` – Assigns the result to a variable called “nature_counts”. 7. `print(‘nature:’, nature_counts)` – Prints the label “nature:” followed by the counts. 8. `print(‘*’* 100)` – Prints a divider line of 100 asterisks to separate this output from what follows.
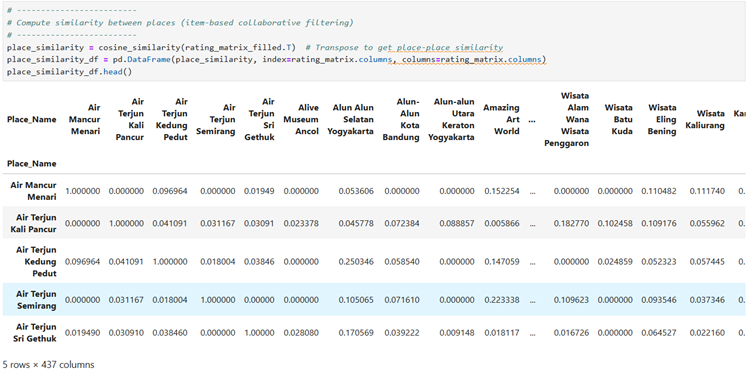
Output is as follows:
So this is all about codes, explanation and output for Part 2. Now we will work on another part of project ‘VGG’ – Part 1.